Modern ESP32 Environment Monitor Standalone Temp & Humidity

Fiqra Putra Lesmana
Author
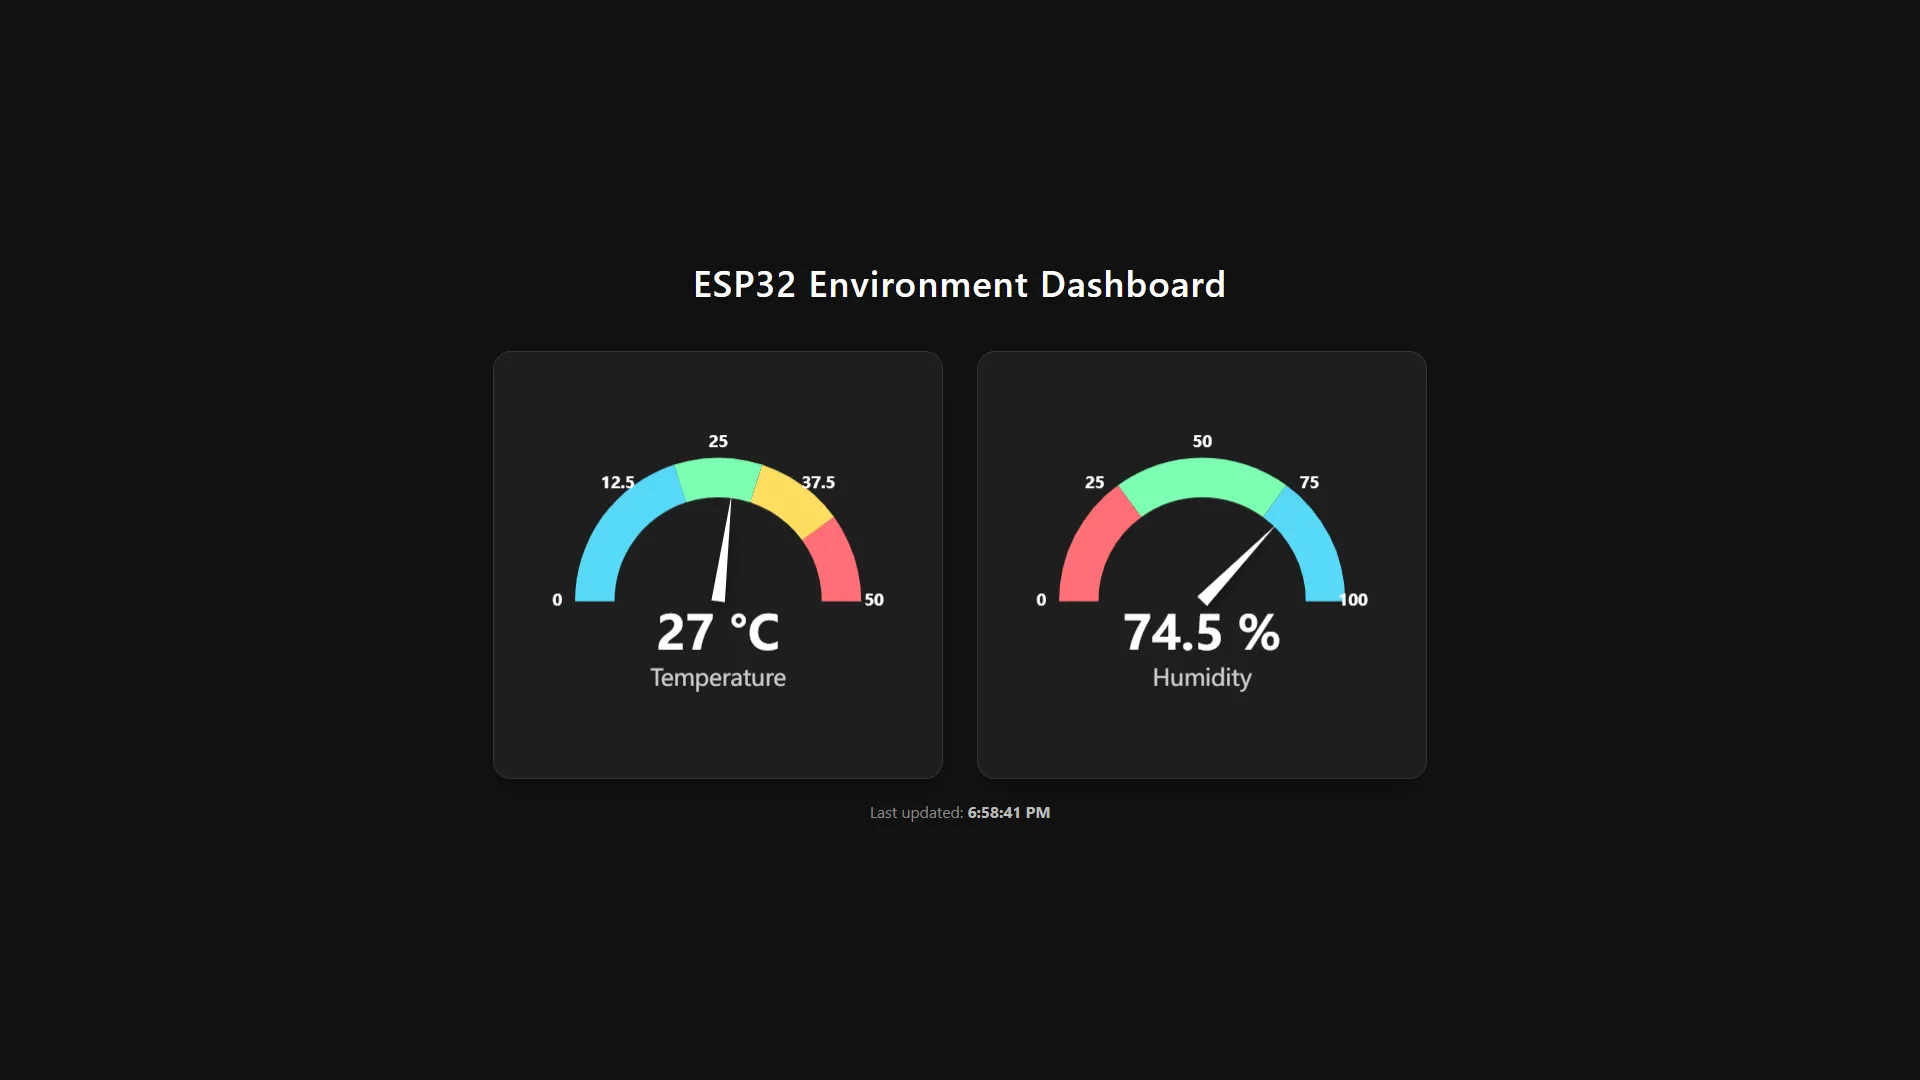
Sleek, standalone ESP32 web dashboard displaying real-time temp & humidity using dark-mode Apache ECharts. No external backend required.
Things used in this project
• Hardware components
ESP32
DHT11 Temperature Humidity Sensor
Male/Female Jumper Wires
• Software apps
Arduino IDE
Story
A lot of standard microcontroller sensor projects end up displaying data as boring text strings or on very clunky web interfaces. I wanted to build an environment monitoring dashboard that is not only highly functional but also looks like a polished, production-grade digital product.
This project is a standalone local web server running directly off an ESP32. It reads data from a DHT sensor (like a DHT11 or DHT22) and visualizes it using clean, modern Gauge Charts. To pull off this aesthetic, I integrated the Apache ECharts library via CDN directly into the HTML. The UI is built with a strict, eye-friendly Dark Mode and includes a real-time "last updated" timestamp.
The best part? There is no external server or complicated cloud setup involved. The entire web page—HTML, CSS, and the charting JavaScript—is stored entirely in the ESP32's flash memory using PROGMEM (R"rawliteral(...)) inside a single .ino sketch file. The code is extremely lightweight and responsive. I even built a temporary dummy-data generator into the code so I could perfectly fine-tune the web UI/UX before wiring up the actual hardware sensor.
If you need to monitor a bedroom, a server rack, or a greenhouse over your local Wi-Fi, this project gives you an incredibly professional-looking dashboard right out of the box!
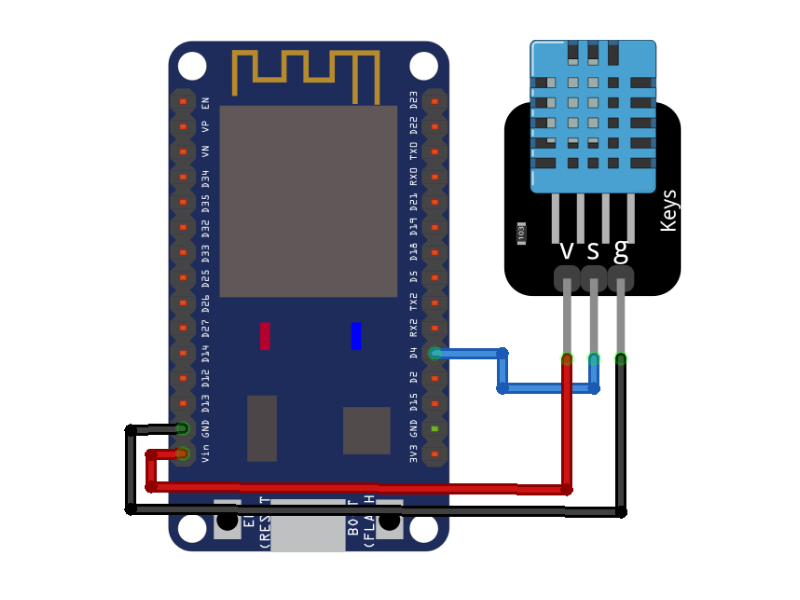
Schematics
esp32_dht11_wiring.png
Code
esp32_environment_monitor.ino
#include <WiFi.h>
#include <WebServer.h>
#include "DHT.h"

// --- WIFI CONFIGURATION ---
const char* ssid = "***";
const char* password = "***";

// Adjust to the pin you are using
#define DHTPIN 4
#define DHTTYPE DHT11

DHT dht(DHTPIN, DHTTYPE);
WebServer server(80);

// --- MAIN HTML PAGE ---
const char index_html[] PROGMEM = R"rawliteral(
<!DOCTYPE html>
<html lang="en">
<head>
    <meta charset="UTF-8">
    <meta name="viewport" content="width=device-width, initial-scale=1.0">
    <title>ESP32 Local Monitoring</title>
    <!-- ECharts CDN -->
    <script src="https://cdn.jsdelivr.net/npm/echarts@5.5.0/dist/echarts.min.js"></script>
    <style>
        * {
            box-sizing: border-box;
            margin: 0;
            padding: 0;
        }
        body {
            font-family: 'Segoe UI', Tahoma, Geneva, Verdana, sans-serif;
            background-color: #121212;
            color: #ffffff;
            display: flex;
            flex-direction: column;
            align-items: center;
            justify-content: center;
            min-height: 100vh;
            padding: 20px;
        }
        h1 {
            font-weight: 600;
            margin-bottom: 40px;
            text-align: center;
            letter-spacing: 1px;
            text-shadow: 0 2px 4px rgba(0,0,0,0.5);
        }
        .dashboard {
            display: flex;
            flex-wrap: wrap;
            gap: 30px;
            justify-content: center;
            width: 100%;
            max-width: 900px;
        }
        .card {
            background: #1e1e1e;
            border-radius: 16px;
            box-shadow: 0 10px 20px rgba(0,0,0,0.3);
            padding: 30px;
            width: 100%;
            max-width: 400px;
            height: 380px;
            display: flex;
            flex-direction: column;
            align-items: center;
            border: 1px solid #333;
            transition: transform 0.3s ease, box-shadow 0.3s ease;
        }
        .card:hover {
            transform: translateY(-5px);
            box-shadow: 0 15px 30px rgba(0,0,0,0.5);
        }
        .gauge-container {
            width: 100%;
            height: 100%;
        }
        .status {
            margin-top: 20px;
            font-size: 14px;
            color: #888;
        }
        #last-update {
            font-weight: bold;
            color: #bbb;
        }
    </style>
</head>
<body>

    <h1>ESP32 Environment Dashboard</h1>

    <div class="dashboard">
        <!-- Temperature Card -->
        <div class="card">
            <div id="tempGauge" class="gauge-container"></div>
        </div>
        <!-- Humidity Card -->
        <div class="card">
            <div id="humGauge" class="gauge-container"></div>
        </div>
    </div>

    <div class="status">
        Last updated: <span id="last-update">-</span>
    </div>

    <script>
        function createGaugeOption(name, min, max, unit, colors) {
            return {
                series: [
                    {
                        type: 'gauge',
                        center: ['50%', '60%'],
                        radius: '80%',
                        startAngle: 180,
                        endAngle: 0,
                        min: min,
                        max: max,
                        splitNumber: 4,
                        itemStyle: {
                            color: '#ffffff',
                            shadowColor: 'rgba(0,0,0,0.4)',
                            shadowBlur: 10,
                            shadowOffsetX: 2,
                            shadowOffsetY: 2
                        },
                        progress: {
                            show: false
                        },
                        pointer: {
                            show: true,
                            icon: 'path://M12.8,0.7l12,40.1H0.7L12.8,0.7z',
                            length: '75%',
                            width: 12,
                            offsetCenter: [0, '0%']
                        },
                        axisLine: {
                            lineStyle: {
                                width: 35,
                                color: colors
                            }
                        },
                        axisTick: {
                            show: false
                        },
                        splitLine: {
                            show: true,
                            length: 35,
                            lineStyle: { color: '#1e1e1e', width: 4 }
                        },
                        axisLabel: {
                            distance: -65,
                            color: '#fff',
                            fontSize: 14,
                            fontWeight: 'bold'
                        },
                        title: {
                            show: true,
                            offsetCenter: [0, '55%'],
                            fontSize: 20,
                            color: '#ccc'
                        },
                        detail: {
                            valueAnimation: true,
                            fontSize: 42,
                            fontWeight: 'bold',
                            color: '#fff',
                            offsetCenter: [0, '25%'],
                            formatter: '{value}' + unit
                        },
                        data: [{ value: 0, name: name }]
                    }
                ]
            };
        }

        var tempChart = echarts.init(document.getElementById('tempGauge'));
        var humChart = echarts.init(document.getElementById('humGauge'));

        var tempColors = [
            [0.4, '#58D9F9'],
            [0.6, '#7CFFB2'],
            [0.8, '#FDDD60'],
            [1.0, '#FF6E76']
        ];

        var humColors = [
            [0.3, '#FF6E76'],
            [0.7, '#7CFFB2'],
            [1.0, '#58D9F9']
        ];

        tempChart.setOption(createGaugeOption('Temperature', 0, 50, ' °C', tempColors));
        humChart.setOption(createGaugeOption('Humidity', 0, 100, ' %', humColors));

        function fetchData() {
            fetch('/data')
                .then(response => response.json())
                .then(data => {
                    tempChart.setOption({
                        series: [{ data: [{ value: data.temperature, name: 'Temperature' }] }]
                    });
                    humChart.setOption({
                        series: [{ data: [{ value: data.humidity, name: 'Humidity' }] }]
                    });

                    const now = new Date();
                    document.getElementById('last-update').innerText = now.toLocaleTimeString();
                })
                .catch(error => console.error('Failed to fetch data from ESP32:', error));
        }

        fetchData();
        setInterval(fetchData, 3000);

        window.addEventListener('resize', function() {
            tempChart.resize();
            humChart.resize();
        });
    </script>
</body>
</html>
)rawliteral";

void handleRoot() {
  server.send(200, "text/html", index_html);
}

void handleData() {
  // Read real sensor data
  float h = dht.readHumidity();
  float t = dht.readTemperature();

  // Check if sensor reading failed
  if (isnan(h) || isnan(t)) {
    Serial.println("Failed to read from DHT sensor!");
    h = 0.0;
    t = 0.0;
  }

  // Create JSON string manually
  String json = "{";
  json += "\"temperature\":";
  json += String(t, 1);
  json += ", \"humidity\":";
  json += String(h, 1);
  json += "}";

  server.sendHeader("Access-Control-Allow-Origin", "*");
  server.send(200, "application/json", json);
}

void setup() {
  Serial.begin(115200);

  // Initialize DHT sensor
  dht.begin();

  // Start WiFi connection
  WiFi.begin(ssid, password);
  Serial.print("Connecting to WiFi");

  while (WiFi.status() != WL_CONNECTED) {
    delay(500);
    Serial.print(".");
  }

  Serial.println("\n");
  Serial.println("=== WiFi Connected ===");
  Serial.print("ESP32 IP Address: ");
  Serial.println(WiFi.localIP());
  Serial.println("Open this IP Address in your browser!");
  Serial.println("======================");

  // Endpoint Routing
  server.on("/", HTTP_GET, handleRoot);
  server.on("/data", HTTP_GET, handleData);

  // Start the server
  server.begin();
}

void loop() {
  server.handleClient();
}
• How do you use it?
Enter your WiFi credentials (ssid and password) into the code.
Upload the code to your ESP32 using the Arduino IDE. Open the Serial Monitor (115200 baud rate) to get the ESP32's local IP Address.
Open that IP address in any browser on a phone or PC connected to the same WiFi network.
Comments (0)
Leave a Reply
No comments yet. Be the first to share your thoughts!
Continue Reading